
How to Read Sales Reports and Make Better Business Decisions
A report should change what you do next. Learn which numbers matter, what they do not prove and how to turn shop data into pricing, stock, collection and customer decisions.
Quick answer
How should a shop owner read a sales report?
Start with a clear date range, compare sales and order count with the previous equivalent period, then examine average order value, credit outstanding, discounts, payment collection, top products and stock health. Investigate the cause before acting; one number rarely explains the full business.
Many owners open a report, look at total sales and close it. That answers only “How much was billed?” It does not explain whether growth came from more customers, larger orders, a temporary bulk sale or heavier discounting. It also does not show how much cash was collected or whether profitable products were sold.
DukaanAdda provides an overview plus Sales, Profit & Loss, GST, Inventory and Payment reports, with customer and product shortcuts. This guide explains how to connect those views and make a decision that can be checked in the next reporting period.
The foundation
Fix the data before trusting the report
Reports summarise saved transactions. If bills are missing, payment modes are wrong, purchase prices are zero or products are duplicated, the chart can look precise while describing an inaccurate business.
- Every sale is saved once with the correct items and quantities.
- Cash, UPI, Bank and Due modes reflect what actually happened.
- Cancelled, returned or corrected transactions follow the proper workflow.
- Product purchase prices are maintained for useful cost and profit estimates.
- Customers are selected consistently instead of using duplicate accounts.
- Stock changes are recorded with the right movement and reason.
At closing, compare recorded cash with the cash drawer, UPI and bank collections with real account entries, and Due sales with customer ledgers. Investigate differences before using the day as a performance benchmark.
A report is evidence, not certainty
Step 1
Choose the right date range and comparison
DukaanAdda report selectors support Today, Yesterday, This Week, This Month and Custom Range. The app compares standard ranges with the relevant previous period: today versus yesterday, this week versus last week and this month versus last month. A custom range uses the preceding period.
| Question | Useful range | Caution |
|---|---|---|
| Did today improve? | Today | Yesterday may have different weekday demand |
| Is the current pattern stable? | This Week | An incomplete week needs context |
| Are monthly decisions working? | This Month | Seasonality can affect comparison |
| What happened during a campaign? | Custom Range | Compare equal-length periods |
Avoid comparing a festival week with a normal week and calling the difference permanent growth. Add context such as holidays, stockouts, a large B2B order, weather, closures or a promotion.
Step 2
Read the six core Sales Report metrics
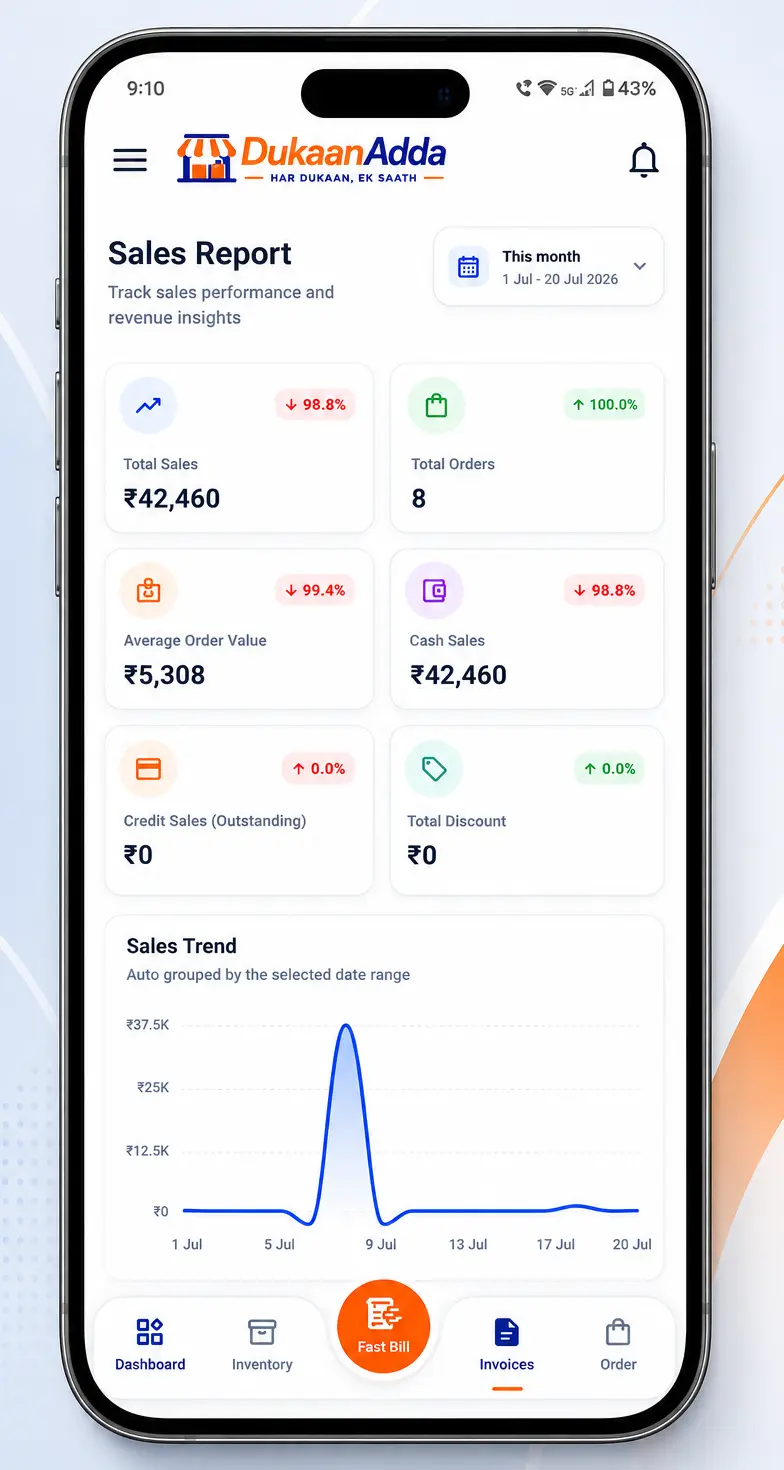
The detailed Sales Report shows Total Sales, Total Orders, Average Order Value, Cash Sales, Credit Sales Outstanding and Total Discount. Read them together instead of celebrating one green percentage.
Total Sales
Recorded sales value for the selected period.
Ask: Check whether collection and profit also improved.
Total Orders
Number of recorded bills or orders.
Ask: Growth may come from more transactions, not bigger baskets.
Average Order Value
Average recorded value per order.
Ask: A single large invoice can distort a short period.
Cash Sales
Sales recorded through the cash mode.
Ask: Reconcile with physical cash, not only the report.
Credit Sales Outstanding
Recorded sales amount still pending.
Ask: An increase can weaken cash flow even when sales rise.
Total Discount
Discount value recorded on sales.
Ask: Compare with margin and authorisation policy.
Example: total sales rise 12%, orders rise 20% and average order value falls. The shop attracted more transactions, but the typical basket became smaller. A useful response may be better cross-selling or product bundles—not simply more advertising.
Step 3
Use the sales trend to find when change happened
A period total hides timing. The Sales Trend chart groups data automatically for the chosen range. Look for spikes, long flat areas, repeated busy days and sudden drops.
A spike may be a successful day, but it may also be one large wholesale bill. Open recent sales and identify which orders created it. A drop may reflect lower demand, a shop closure, missing billing entries or an out-of-stock bestseller.
Trend is a prompt to investigate
Step 4
Find the products and categories driving sales
Sales value becomes actionable when connected to items. The Sales Report includes category breakdown and top-selling products, while the main overview shows best-selling products. Use these views to identify repeat demand.
A top product deserves reliable availability, but do not order only from rank. Check current stock, supplier lead time, purchase cost, shelf life and whether sales came from a one-time bulk order. For a weak product, review visibility, price, stockouts and whether it solves the same need as a stronger variant.
Protect winners
Keep proven fast movers available.
Review mix
See which categories concentrate sales.
Test basket ideas
Pair complementary items carefully.
Product naming and category data must be consistent. Duplicated items split sales across records and make a true bestseller appear weaker. Use the inventory management mistakes guide to clean the underlying product master.
Step 5
Separate billed sales from collected money
Sales do not automatically mean money is available. The Payment Report shows Total Billing, Total Collected, Cash, UPI, Bank Transfer and Pending Payments. It also includes payment-method breakdown, collections trend, method performance and recent payments with All, Cash, UPI, Bank and Pending filters.
Reconcile each recorded mode with the real source. Cash should match the drawer after expenses and approved removals. UPI and Bank should match account statements. Pending should connect to customer or invoice follow-up.
A simple collection check
1. Compare
Recorded mode against the actual receipt source.
2. Explain
Identify timing, mode or missing-entry differences.
3. Correct
Use the proper transaction workflow and preserve evidence.
If sales rise but pending payments rise faster, tighten credit review and collection—not necessarily sales activity. Read the Khata and Udhar management guide for a customer-wise collection process.
Step 6
Understand who is buying and how
The report overview includes New Customers and Top Customers. Top-customer ranking is based on recorded spend and order count, while new-customer calculations compare customer activity in the selected and preceding periods.
A valuable customer is not only the highest spender. Check payment reliability, return behaviour, margin, order frequency and outstanding credit. A customer with high sales and late payments may require different terms from a smaller customer who pays immediately.
Customer Report shortcut
Step 7
Connect sales performance with inventory health
The Inventory Report includes total products, total stock value, low-stock items, out-of-stock items, movement trend, category distribution, top-moving products, stock-health overview and recent activity.
Compare top-selling products with low and out-of-stock lists. A sales decline caused by unavailable stock needs replenishment, while a decline with plenty of stock may need pricing, placement or demand review. High stock value in slow-moving categories can tie up cash.
High sales + low stock
Protect availability and review supplier lead time.
Low sales + high stock
Investigate product fit before buying more.
Step 8
Use the Profit & Loss report with its current scope
DukaanAdda's Profit & Loss report shows Total Revenue, Total Expenses, Gross Profit, Net Profit Margin, profit trend, revenue-versus-expense and cost breakdowns, plus invoice-level entries and PDF export.
In the current calculation, revenue is recorded bill total minus tax. Cost of goods sold is item quantity multiplied by the saved product purchase price. Gross profit is revenue minus that cost.
Current report formula
Gross profit estimate = revenue excluding tax − recorded cost of goods sold
Important P&L limitation
Missing purchase prices make cost data incomplete and can overstate profit. Maintain product cost consistently before using the margin for pricing decisions.
Step 9
Treat the GST report as an internal billing summary
The GST Report summarises taxable sales, output GST, CGST, SGST, IGST, rate slabs, recent GST invoices, B2B/B2C counts, HSN-based groupings and trend information from recorded bills. It can be exported as PDF.
This helps check billing consistency, but it is not a GST portal return. In the current report calculation, input tax credit is zero, GST payable equals recorded output GST, filing status is not available, and reverse-charge and cess values are not populated as a complete compliance ledger.
Do not file from the report alone
Action framework
Turn one report finding into a measurable decision
- 1
Choose one question
For example: why did weekly cash collection fall?
- 2
Select an equal comparison
Use the same period length and note special events.
- 3
Verify the base data
Check bills, payment modes, products and customer records.
- 4
Find the driver
Separate order count, basket value, credit and stock effects.
- 5
Take one action
Assign an owner, start date and a measurable target.
- 6
Review the next period
Keep, adjust or stop the action based on evidence.
Example: credit outstanding increased for three weeks. Verify that payment modes are correct, identify the customers and invoices responsible, tighten approval for new Due sales and schedule collection follow-up. Measure outstanding again next week.
Team process
Daily, weekly and monthly reporting routine
Daily
- Sales and order count
- Cash/UPI/Bank reconciliation
- Pending payments
- Unusual bills or discounts
Weekly
- Sales trend
- Top products and categories
- Low/out-of-stock items
- High outstanding customers
Monthly
- Revenue and gross profit estimate
- Stock value and slow movers
- GST billing summary
- Actions versus previous month
Export a PDF when a permanent review copy is useful, but keep the original app data as the current source. A PDF reflects the selected period and the records available when it was created.
Avoid these
Common sales-reporting mistakes
Looking only at sales
Collection, margin and stock may move in the opposite direction.
Comparing unequal periods
Different durations or seasons create false conclusions.
Trusting one large spike
A bulk invoice can distort averages and trends.
Ignoring data quality
Wrong modes, costs or product records corrupt the summary.
Treating gross profit as net profit
Operating expenses are outside the current P&L source.
Using GST summary as a return
ITC and compliance require external reconciliation.
Acting without an owner
A good insight creates no result unless someone changes the process.
Reviewing without follow-up
A decision needs a later period and measurable outcome.
FAQ
Sales and business-report questions
Which sales metrics should a small retailer check first?
Start with total sales, total orders, average order value, credit sales outstanding and payment collection. Then use sales trends, top products and inventory health to understand why the numbers changed.
What date filters are available in DukaanAdda reports?
The verified report selector supports Today, Yesterday, This Week, This Month and a Custom Range. Comparison labels use the relevant previous day, week, month or preceding period.
What is average order value?
Average order value is the average recorded sale amount per order in the selected period. It helps distinguish growth caused by more transactions from growth caused by customers spending more per transaction.
What does the Sales Report contain?
It includes total sales, total orders, average order value, cash sales, credit sales outstanding, total discount, a sales trend, category breakdown, top-selling products, payment-method sales and recent sales.
Can DukaanAdda export reports as PDF?
Yes. The overview, Sales, Profit & Loss, GST, Inventory and Payment report workflows include PDF export using the selected report data and date range.
Does the Profit & Loss report include every business expense?
No. The current calculation uses sales revenue excluding tax and cost of goods based on recorded product purchase prices. The source does not currently include a separate operating-expense ledger, so rent, salaries, electricity and similar costs are not automatically included.
Is the DukaanAdda GST report the same as a filed GST return?
No. It is an internal billing summary based on recorded invoices. Current input tax credit is zero in the report calculation, GST payable equals recorded output GST, and filing status is not available. Verify portal data and use professional tax advice for compliance.
Can I view reports when offline?
Some report screens can show locally cached data in offline mode. The app labels that state and disables fresh date-range interaction. Sync when connectivity returns before treating the figures as final.
How can sales reports improve stock purchasing?
Compare top-selling products and category demand with low-stock, out-of-stock, movement and inventory-value information. Reorder based on repeat demand and lead time rather than sales value alone.
How often should a shop owner review reports?
Review payments and unusual sales daily, products and stock weekly, and broader sales, profit, GST and customer patterns monthly. The right frequency depends on transaction volume and business risk.
Turn shop data into the next practical action
Use DukaanAdda for billing, inventory, customers, Khata, payments and business reports on Android and Windows.
Download DukaanAdda